 eAtlas Data Catalogue
CSIRO Land and Water Flagship
Type of resources
Topics
Keywords
Contact for the resource
Provided by
Representation types
status
-
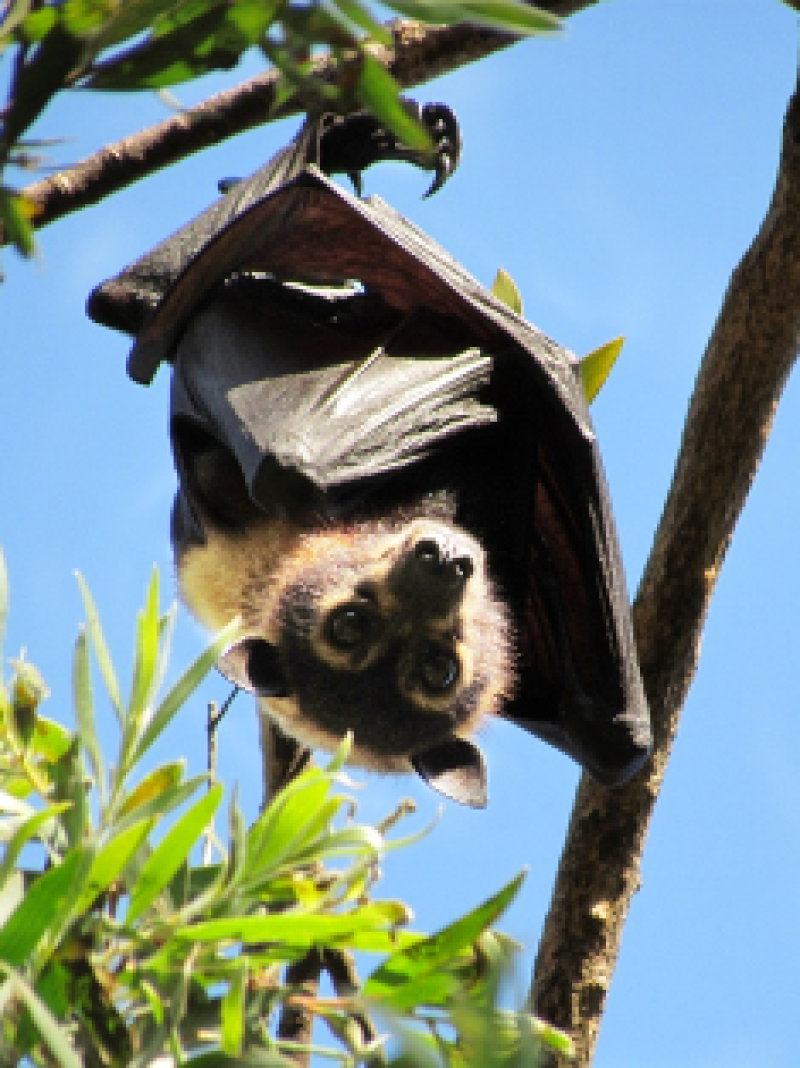
This data set shows the occupancy and size of spectacled flying-fox camps across the distribution of the spectacled flying-fox in the Wet Tropics Region. Camp locations are also provided. Data was collected monthly and all camps in the region were monitored each month. This data was collected to provide information on the dynamics in abundance and distribution of the spectacled flying-fox. It is part of a long term monitoring program that has been running since 2004. For further information see the publicaton: Tait, J., Perotto-Baldivieso, H. L., McKeown, A., & Westcott, D. A. (2014). Are Flying-Foxes Coming to Town? Urbanisation of the Spectacled Flying-Fox (Pteropus conspicillatus) in Australia. DOI: 10.1371/journal.pone.0109810 This dataset is a subset of the complete time series corresponding to the collection period of the NERP TE program, from June 2011 - Oct 2014. Methods: Monthly surveys were conducted as daytime ground counts and followed the methodology outlined for the National Flying-fox Monitoring Program (Westcott et al. 2011; http://www.environment.gov.au/system/files/pages/391f5fed-e287-4dd3-85ac-640037926ef5/files/310112-monitoring-methodology.pdf). Surveys were conducted by a single surveyor. All camps were surveyed over a 2-3 day period. Limitations: This data covers the ‘counted’ population only. An unknown and variable proportion of the population roost in unknown locations. Format: The data is provided as a 28 kb Excel file with camp names, latitude and longitude of camp location and columns for each survey month. Camps are never dropped from the survey so blanks represent camps with no spectacled flying-foxes present during the survey. References: Westcott D. A. & McKeown A. (2004) Observer error in exit counts of flying-foxes (Pteropus spp.). Wildl. Res. 31, 551-8. Westcott D. A., McKeown A., Murphy H. T. & Fletcher C. S. (2011) A monitoring method for the greyheaded flying-fox, Pteropus poliocephalus. A report to the Commonwealth Department of Sustainability, Environment, Water, Population and Communities. p. 58. CSIRO Ecosystem Sciences, Atherton, Australia. Westcott D. A., Fletcher C. S., McKeown A. & Murphy H. T. (2012) Assessment of monitoring power for highly mobile vertebrates. Ecol. Appl. 22, 374-83.
-
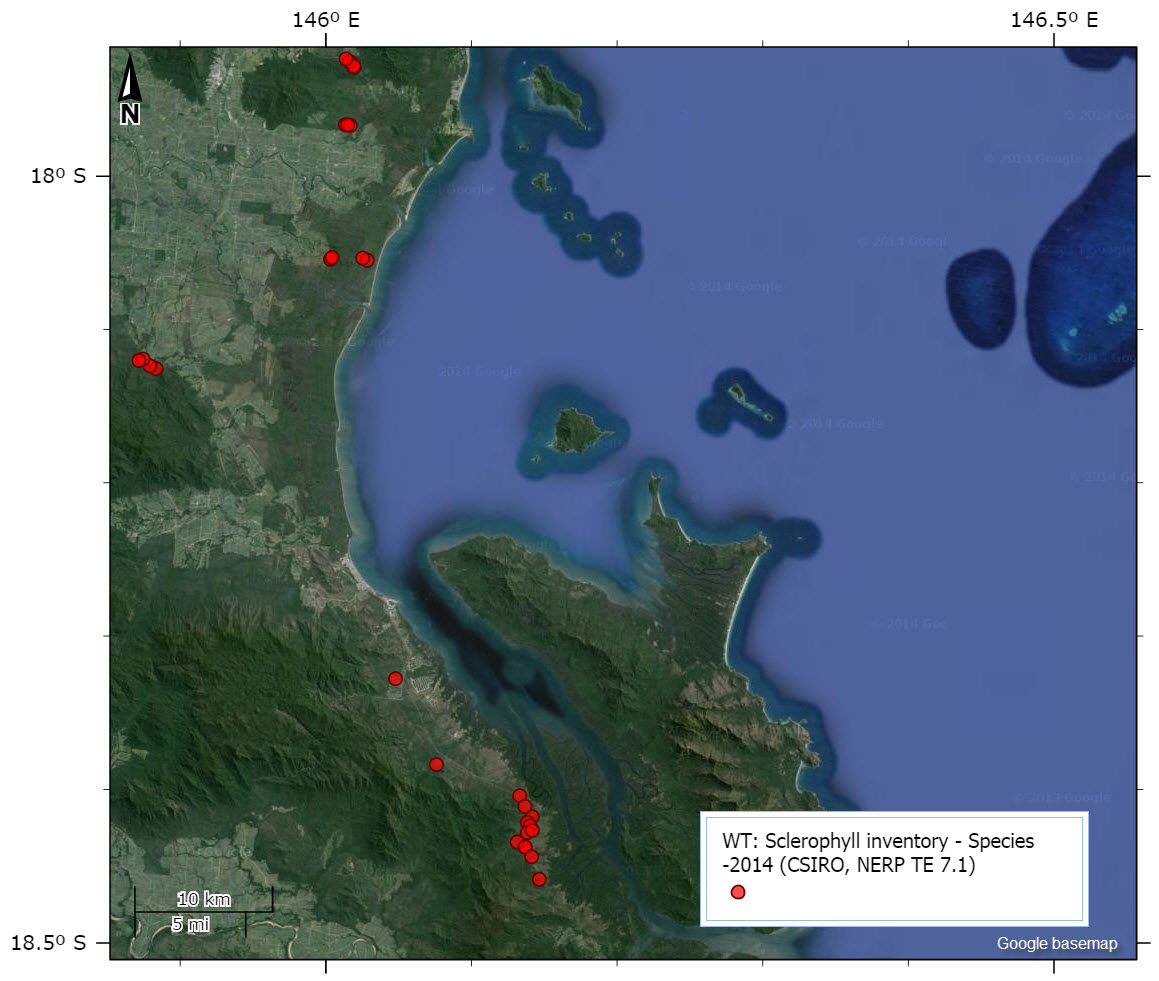
This dataset consists of 31 monitoring sites in the Tully-Ingham area. Sites have various levels of rainforest invasion. Each site has a vegetation strata species list and counts of each species in each strata. Trees with stems > 10cm Diameter Breast Height (DBH) are identified and their DBH and height are measured. Date of survey May-July 2014. This dataset was originally designed to monitor the habitat of Mahogany Gliders and what effect fire had on different levels of rainforest invasion. Will a fire kill rainforest plants/seedlings? Can a heavily invaded sclerophyll community be reverted back to a grassy woodland with active fire management. The strata-based species lists (with counts) provides an insight as to the species turnover and recruitment/survivorship following a fire or following a control. Only botanical names are used in the lists. Methods: The monitoring sites were established between 2011 and 2012. The 31 sites occur on the coastal plain between Tully and Ingham, with most sites occurring on alluvium. Sites were categorised at establishment according to the level of rainforest invasion into the sclerophyll community. Categories were: low, medium and high, with low meaning few rainforest plants present. Each site is 20m x 20m and a geocode supplied for the south-east corner, which is permanently marked with a star picket. A star picket is also present in approx. the middle of the plot too. Within each site the community is divided into strata, or layers, of plants which more or less follows the methodology of the Queensland Herbarium. All sites have a ground layer, which is usually dominated by grasses or sedges. All sites have an upper tree layer and most sites have a shrub layer. Each layer has its own specific species list, identified usually to species level. Counts of all species in each strata exists, with numbers being actual from 1-10, estimates in units of 10’s to 100, estimates in the 100’s to 1000. Often for the ground layer, a cover or, a proportion in area is given in m2. Voucher specimens for many species exist at the Australian Tropical Herbarium and the Queensland Herbarium. Each strata is delineated by height, which is provided. All plants with a stem DBH > 10cm are identified, measured and heighted to the nearest metre using a laser range finder. For sites which have been burnt, any resprouting by plants is also recorded and usually in its own delimited field or written as ‘resprout’ in the “Cover” field. Limitations: The data supplied is the final inventory from the project. Each site has an establishment survey and a final survey. If a site was burnt during the projects life, that site was re-assessed. Thus, some sites have 3 sets of data. Three sites were established following a catastrophic/high energy wildfire, each reflecting a low, medium and high level of invasion prior to incineration. For these 3 sites there are 3 inventories. Format: Microsoft Office Word Document (.docx). Each strata from each site is presented in table format, with counts or cover in a delimited field adjacent to the botanical name. All fields are intuitive. Excel and Shapefiles To prepare the data for display on the eAtlas the data from the original Word vegetation mapping recording form documents were copied into Excel so that all the data was compiled into 4 tables: Sites, Species, Height-Classes and Large-Trees. Information from the sites was joined onto the Site-survey table using VLookup to add spatial information and site notes to the species observations. This was to make the table suitable for the creation of a shapefile. The Site-surveys and Large-Trees tables were converted to Shapefiles using ArcMap. The Excel file contains all the information in the original word documents except the "Recorder", whether there were photos taken at the site and some non-structured comments in the documents.
-
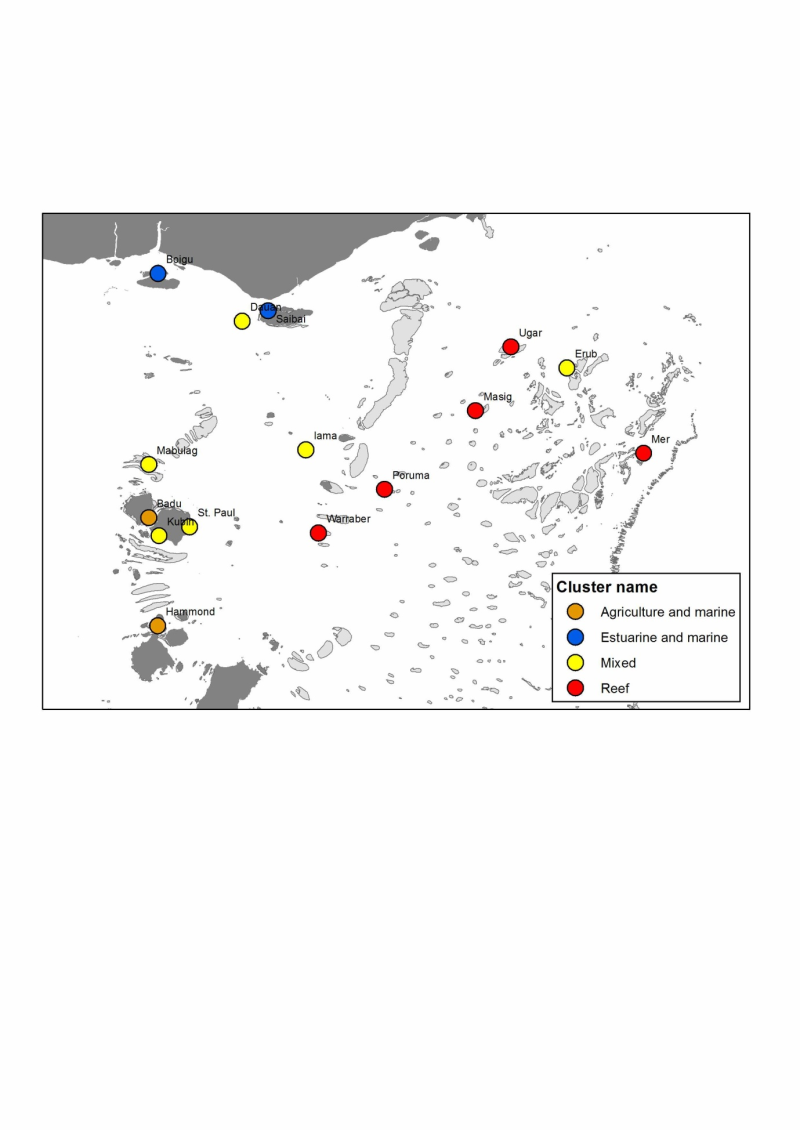
Determining the impact on Torres Strait communities from future changes to ecosystems requires an understanding of the natural resource base that underpins their livelihoods. To do this, we estimate the relative importance of natural resources, or ecosystem goods and services (EGS) to local livelihoods, which in turn is a function of the relative volume of those EGS, and their relative value to human well-being. Our approach was focused on 'provisioning' and 'cultural' EGS, which have a direct link to local livelihoods. This analysis considers the Production of EGS to each of the 14 Torres Strait Protected Zone communities (plus Hammond Island). These were quantified through ranking on a scale of 0 (does not exist) to 5 (largest quantity or volume) with the input of TSRA Land & Sea Management Unit officers with experience of the Torres Strait region's communities: Vic McGrath and Frank Loban. This provided the basis for determining community 'typologies' (i.e. communities that have a similar natural resource base). Using information from the literature on Torres Strait Island communities' livelihoods, plus the TSRA expert knowledge, we formulated a list of 27 significant EGS for Torres Strait. These were then ranked for each community by the TSRA team. This information was then used to produce an overall average EGS Volume ranking for all communities, and for determining community typologies in terms of their EGS resource base. Overall, coastal, pelagic and reef associated finfish, and green turtles had the greatest EGS Volume scores. The top 9 ranked EGS were marine resources, highlighting the strong connection between Torres Strait communities and their 'sea country'. Clustering of EGS Volume scores produced four community types at a distance metric of approximately 1. These were: - Reef: A group mostly made up of eastern and central islands (excluding Erub), and strongly separated from the remaining Torres Strait communities due to a relatively high volume of Reef resources, and low Production of Estuarine resources; - Agriculture and Marine: A group consisting of Badu and Hammond Island only, characterised by high volume of all resources, and relatively low volume of reef associated resources; - Estuarine and marine: A group consisting of Boigu and Saibai, with high volume of estuarine and marine resources, but low volume for most others; - Mixed: A large (and diverse) group of six widespread islands with medium volume for all resources. Method: We formulated a list of 27 significant ecosystem goods and services (EGS) for Torres Strait communities by reviewing the literature and interviewing several natural resource managers in TSRA and AFMA with appropriate expert knowledge. These EGS were then ranked for each community by the expert team through ranking on a scale of 0 (does not exist) to 5 (largest quantity or volume). The data were transformed with sqrt (x / 100), which has the desirable effect of reducing the influence of EGS used by few villages. Agglomerative hierarchical clustering using Ward's clustering criterion was performed with the 'hclust' function of the R statistical package (R Core Team 2013). The resulting dendrogram was reordered based on a PCA of the same data. This information was then used for determining community typologies in terms of their EGS resource base. For more information see the publication: Skewes, T., Rochester, W., Butler, J.R.A., Busilacchi, S., Hunter, C., McGrath, V. and Loban, F. 2012. Preliminary Identification and Valuation of Ecosystem Goods and Services Underpinning Torres Strait Livelihoods. NERP Tropical Ecosystems Hub Project 11.1 Milestone Report, June 2012. http://www.nerptropical.edu.au/Project11.1MilestoneReport-May2012-Preliminaryidentication References: Butler, J.R.A., Bohensky, E., Skewes, T., Maru, Y., Hunter, C., Busilacchi, S., Rochester, W., Johnson, J. and Doupe, J. (2012) Torres Strait Futures: Regional Stakeholders' Future Scenarios and Livelihood Adaptation Strategies. Report to the National Environmental Research Program. Reef and Rainforest Research Centre Limited, Cairns (64 pp). Butler, J.R.A., Rainbird, J., Skewes, T., McGrath, V., Nai, F., Bohensky, E., Maru, Y. & Morseu, F. (2013) Masig Yesterday, Today and Tomorrow: Community Future Scenarios and Adaptation Strategies. Report to the National Environmental Research Program. Reef and Rainforest Research Centre Limited, Cairns (48 pp). Bohensky, E, Butler, J.R.A., Rainbird, J., Skewes, T., McGrath, V., Nai, F., Maru, Y., Morseu, F, & Lankester, A. (2014) Mabuiag Yesterday, Today and Tomorrow: Community Future Scenarios and Adaptation Strategies. Report to the National Environmental Research Program. Reef and Rainforest Research Centre Limited, Cairns (49 pp). Bohensky, E., Butler, J.R.A., Rainbird, J., Skewes, T., McGrath, V., Nai, F., Maru, Y., Morseu, F. & Lankester, A. (2014) Erub Yesterday, Today and Tomorrow: Community Future Scenarios and Adaptation Strategies. Report to the National Environmental Research Program. Reef and Rainforest Research Centre Limited, Cairns (52 pp). Bohensky, E., Butler, J.R.A., Rainbird, J., Skewes, T., McGrath, V., Nai, F., Maru, Y., Hunter, C., Morseu, F. (2014). Adaptation Integration Workshop - The Masig Island Example. Report to the National Environmental Research Program. Reef and Rainforest Research Centre Limited, Cairns (25 pp).
-
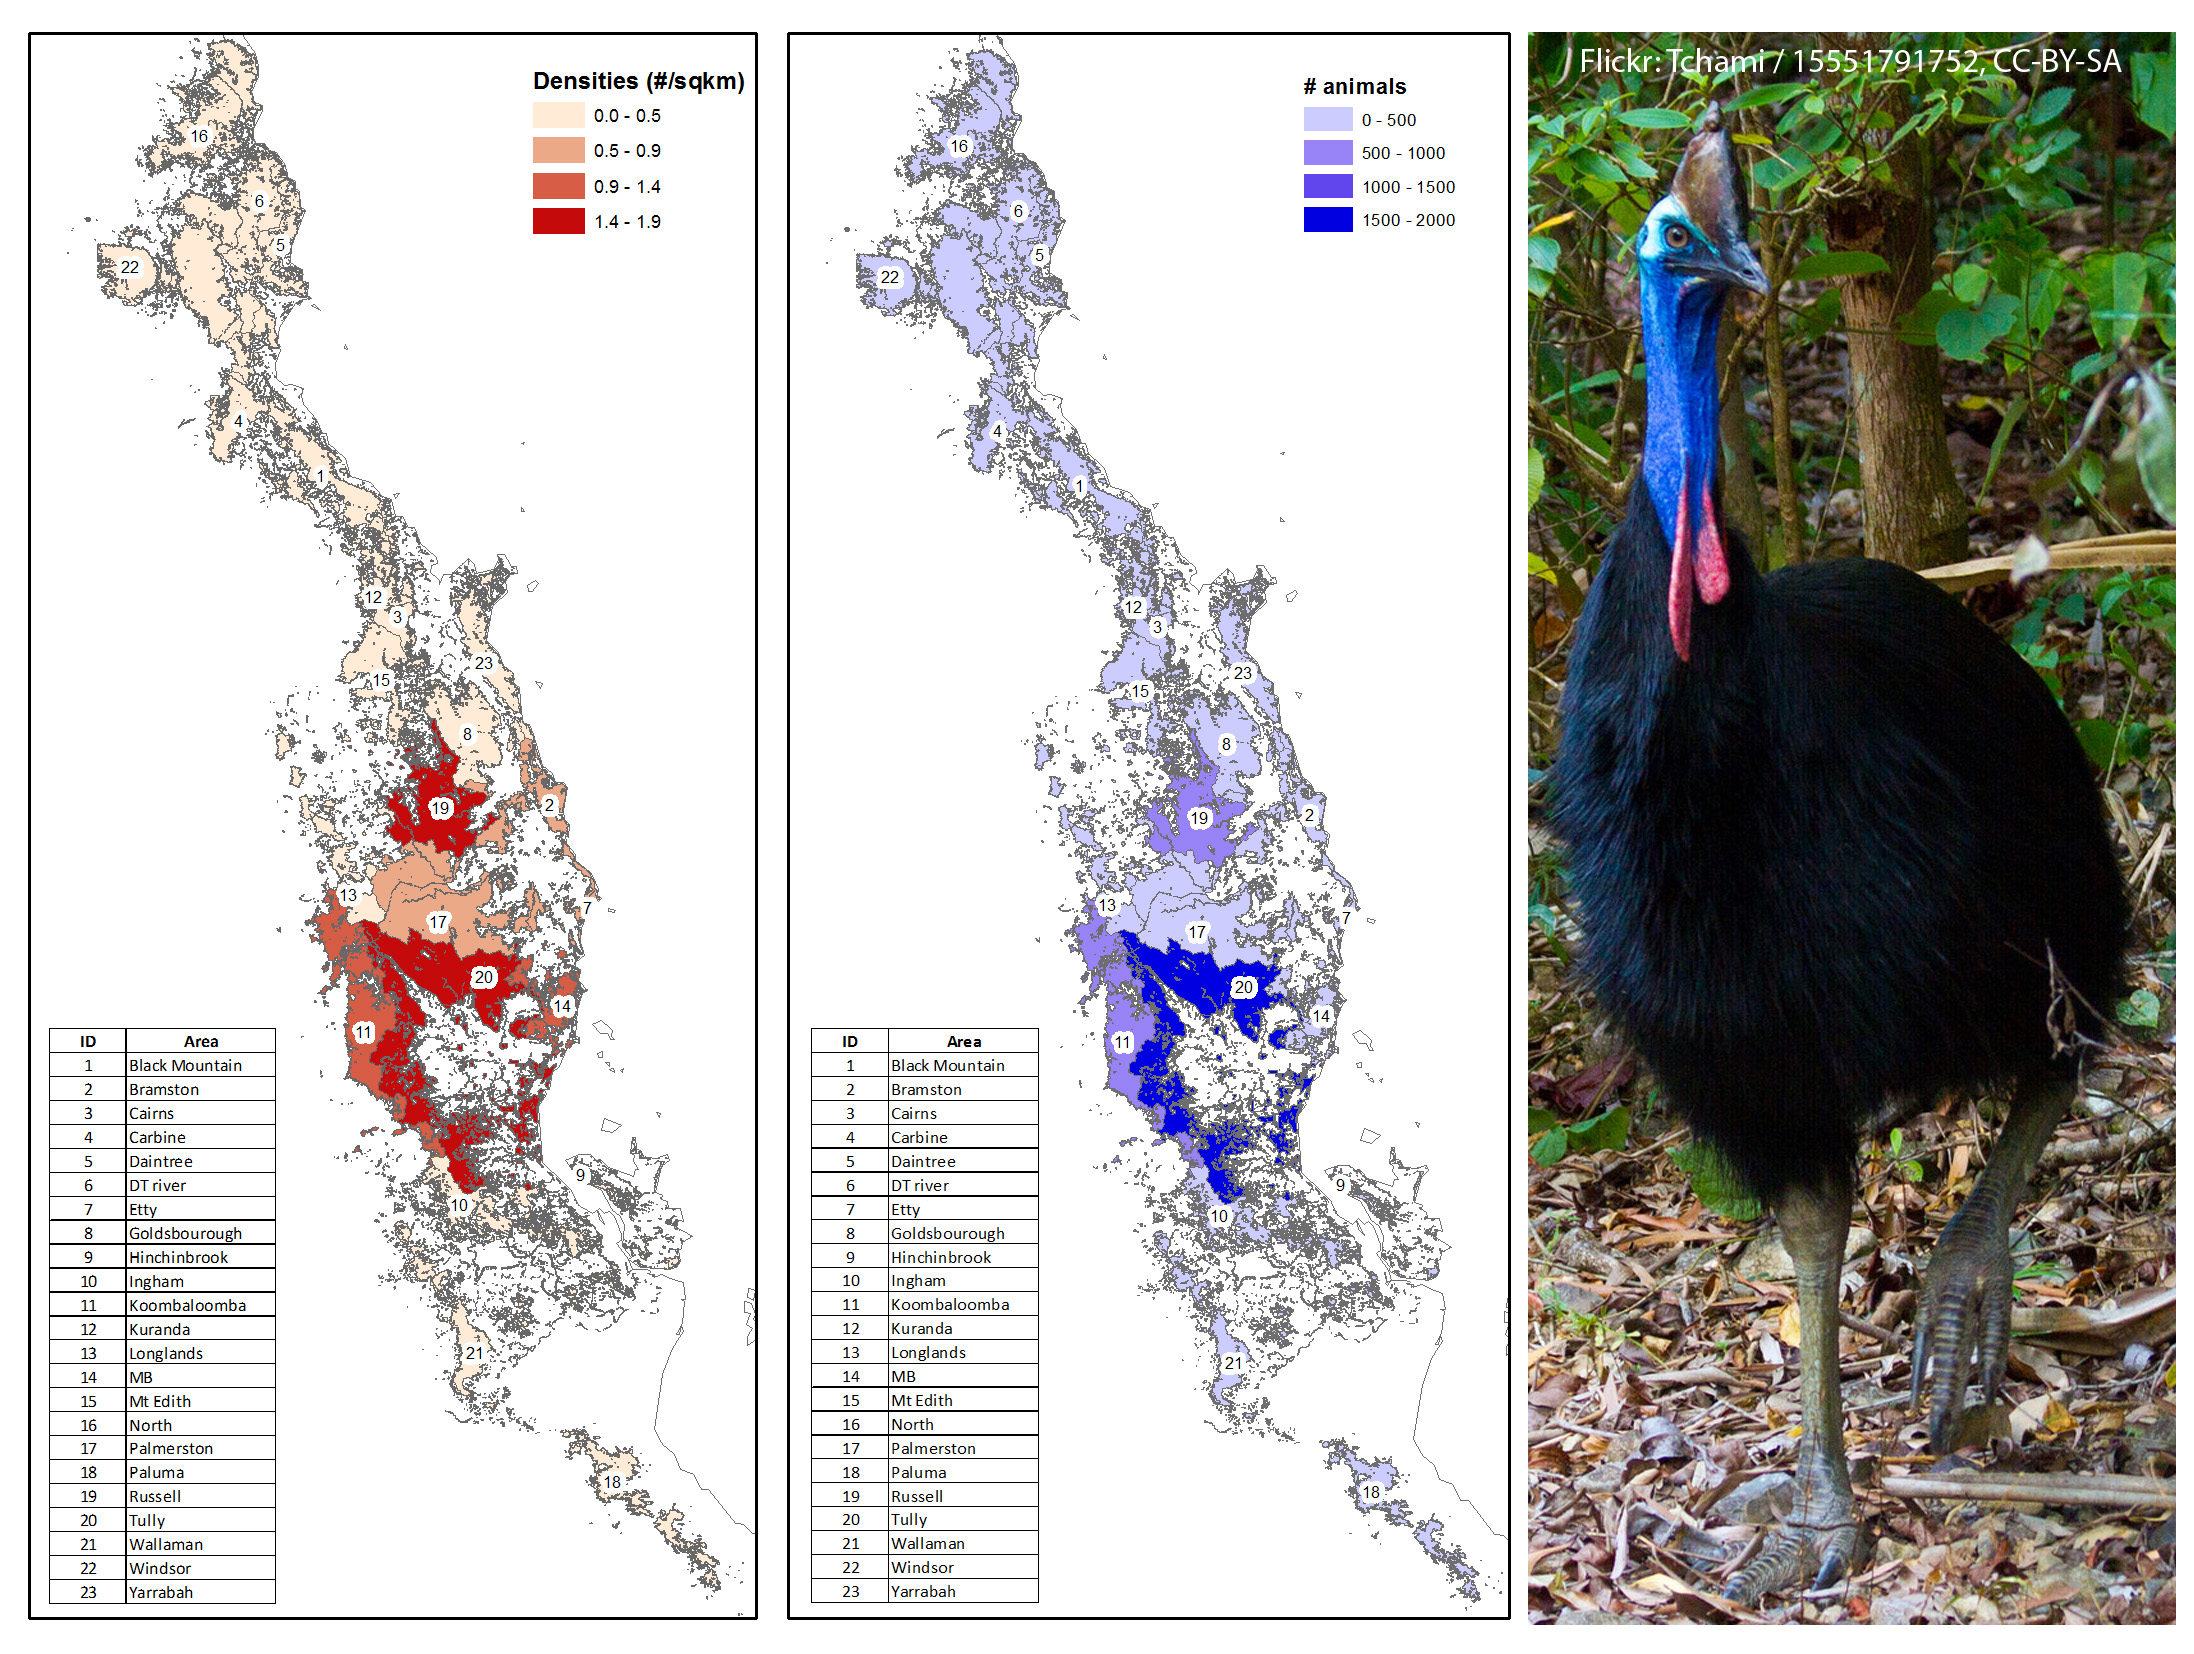
This dataset contains the estimated distribution and abundance of cassowaries across the Wet Tropics Region and the sub-regions used in these estimates. The key areas for cassowary conservation are those with the highest densities and abundance. This data is based on field surveys and data on cassowary density derived from faecal-DNA analysis of dung samples collected during those surveys. Methods: Surveys were conducted along 157 transects distributed across the Wet Tropics Region during 2012 - 2014. During these surveys all forms of cassowary sign were recorded and in the case of dung the dung was also collected. Cassowary DNA was extracted from the dung samples and DNA fingerprinting analysis was used to identify individuals. Based on the relationship between dung encounter rates and density of cassowaries at 8 focal sites, the density of cassowaries and their abundance on transects in each of 23 sub - regions was estimated. The sub - regions were based on the estimated cassowary essential habitat. Essential habitat is based on verified sightings of the Southern Cassowary since 1980 and includes vegetation considered to be important for the species in terms of foraging, breeding or other parts of the species' life cycle. This habitat is considered to be necessary for the long-term survival of the cassowary. The important vegetation types associated with essential habitat (91 Regional Ecosystems) are listed within Kutt and colleagues (2004). Further details of the methods are provided in the technical report for this work, Westcott (2014). Limitations: eAtlas Note: The original shapefile provided by the researchers has very fine boundary mapping from the cassowary essential habitat mapping. This is then broken down into 23 regions. The scale of these two datasets is vastly different and needs to be considered when using or interpreting this data. A slightly lower resolution version of this data was prepared for download from the eAtlas. This reduces the fine scale habitat mapping slightly, whilst retaining the cassowary regional information. The mapping layer associated with this record corresponds to the original high resolution version. Format: Original Shapefile (452 polygons, 25 MB) of the 23 subregions of the Wet Tropics with estimated density and animal numbers. The detail of the region boundaries are based on very detailed estimated essential cassowary habitat mapping Kutt (2004). Simplified Shapefile (23 polygons, 2.6 MB). This contains the same cassowary estimated density and animal numbers across the Wet Tropics except with simplified habitat mapping. This was derived from the original by dissolving polygons with the same data, then smoothing the polygon using a 150m filter, then simplifying the polygon with an allowable tolerance of 15 m and removing features smaller than 2 hectares. This shapefile was prepared by the eAtlas team. This simplified version is more suitable for large scale maps. Data Dictionary: - CassBound: Name of the cassowary mapping region - CassDens: Estimated density of cassowary in animals per square km. - Cass_num: Estimated number of cassowaries in region. - Hectare: Area of the mapping region in Hectares. References: Kutt A. S, King S., Garnett S. T. & Latch P. (2004) Distribution of cassowary habitat in the wet tropics bioregion, Queensland. Technical Report to the Queensland Environmental Protection Agency. Environment Protection Agency, Brisbane, Queensland. Westcott, D.A., Metcalfe, S., Jones, D., Bradford, M., McKeown, A., Ford, A. (2014) Estimation of the population size and distribution of the southern cassowary, Casuarius casuarius, in the Wet Tropics Region of Australia. Report to the National Environmental Research Program. Reef and Rainforest Research Centre Limited, Cairns (21pp.).